
Mining for Under (and Over) Performers: Strikeouts
A while back, I had a little pet project to try and simplify the process of sniffing out the over- and under-performers relative to strikeout rates. More specifically, recognizing the sometimes wild fluctuations between strikeout rates year to year, I wanted a better idea if a particular pitcher earned their increase (or decrease) in the category. Was there a process — similar to the one we use on ERA with batting average on balls in play and strand rates — that we could go through for strikeout rates?
Obviously, a high swinging strike rate suggests an inherent ability to strike batters out. Makes sense –- you don’t miss many bats, you’re not likely to wind up registering many strikeouts. So using the swinging strike rate to potentially identify the pretenders from the contenders has merit as the season wears on. But I wanted to tighten that up a bit — add variables that would perhaps control for another part of a pitcher’s skill set to help us identify who should reasonably be expected to strike out more, or fewer, batters. And of course, this is with fantasy baseball in mind –- so the idea was that we can all outsmart the next guy relative to the strikeout column.
I originally looked at strikeouts per nine innings pitched (K/9) as my dependent variable in the analysis, but as colleague Jeff Zimmerman astutely pointed out to me later, the strikeout percentage is a stronger measure to show actual ability. That is, “three straight strikeouts in an inning is better than three strikeouts and three hits in an inning even though they both end up as the same K/9.” An excellent observation. So back to the drawing board I went, with some improvements to the sample size, the overall data set, and yes, we’ll use strikeout percentage as our dependent variable.
First, the data set.
I’m looking at starting pitchers who tossed at least 100 innings in 2011. In the last study, I only used qualified starters and it served to limit the sample set considerably, so this opens things up accordingly. In order to make a strikeout rate comparison with the previous year, which will help us with the model, I need these pitchers to have thrown at least 100 innings in 2010 as well. So we lose some names in that cut (most notably, guys like Jeremy Hellickson, Jordan Zimmerman, Michael Pineda, Vance Worley, Brandon Beachy, Cory Luebke, and Alexi Ogando).
Next, I only wanted to compare pitchers that use their fastball enough to make the velocity on that pitch relevant, and thus kicked out R.A. Dickey and Tim Wakefield. Comparing their fastball velocity in this sample would only serve to skew the results since they’re obviously working on the knuckler for their outs, by and large. So we lose two more.
What we’re left with is a sample of 97 starting pitchers who have thrown at least 100 innings in the last two seasons.
Running correlations on this group, looking specifically at the variables we have in mind –- 2011 K% (represented in the graphs as K%), 2010 K%, Fastball velocity (FBv) and Swinging Strike rate (SwStr%) — all have statistically significant correlations with 2011 K% at 0.01 significance (incidentally, age was interestingly correlated at -.231, significant at the .05 level…but that’s for another study). The correlations are as follows:
| 2010 K% | FBv | SwStr% | |
|---|---|---|---|
| 2011 K% | 0.754 | 0.543 | 0.825 |
Graphically, looking at the relationships of K% (2011) with 2010 K%, FBv, and SwStr%, you can see that all relationships in the model are statistically significant, and the associated R-squared in each case help define how much of the variance can be explained by that given relationship. In other words, how much of a pitcher’s 2011’s strikeout percentage can be explained by his 2010 K%? How much of that percentage is explained by his fastball velocity? Forgive me for the odd formatting, but if you click on the graph, you should have full functionality to hover over each case to get the name of the pitcher and the two sets of associated data, which is rather fun:
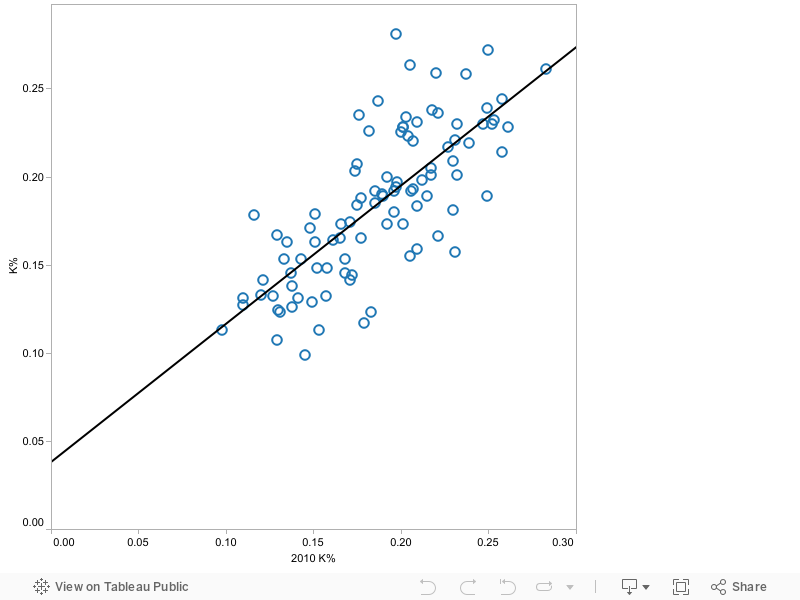
The R-squared for the 2010 K% is 0.568 with a p-value of <0.0001
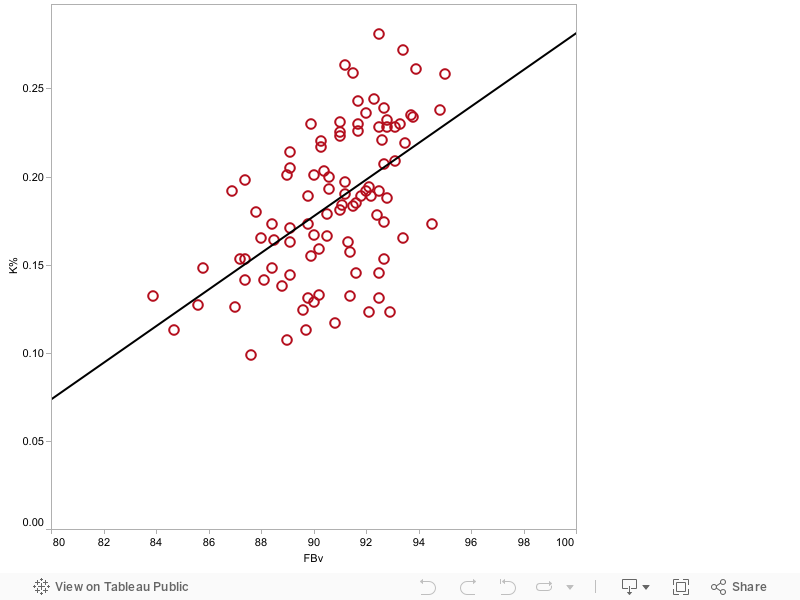
The R-squared for the FBv is 0.295 with a p-value of <0.0001
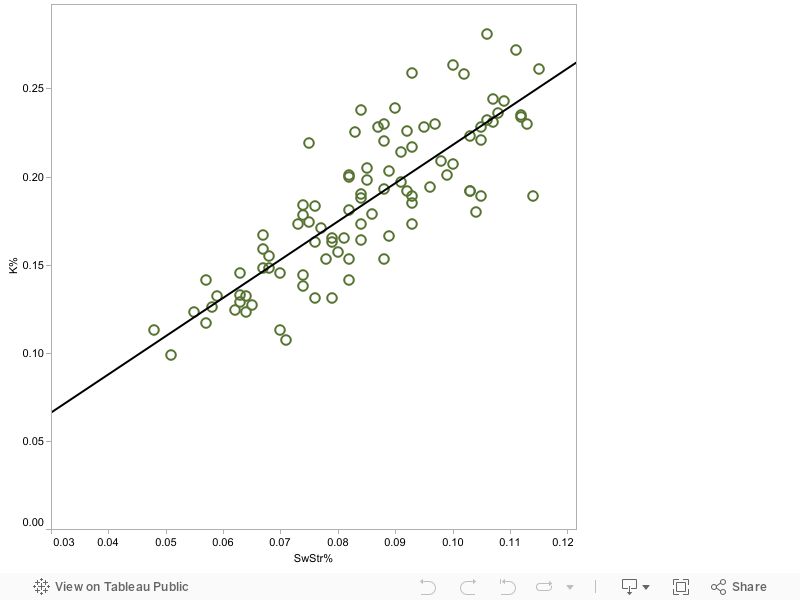
The R-squared for the SwStr% is 0.681 with a p-value of <0.0001
Plugging all three into a linear regression model that uses 2011 K% as our dependent variable — in an effort to come up with an expected K% in 2011 — we find a model represented by this:
xK% = -.278 + (.003)*FBv + (1.428)*SwStr% + (.321)*K% 2010
The model summary and fit:
| R | R Square | Adjusted R Square | Std. Error of the Estimate |
|---|---|---|---|
| 0.877 | .769 | .761 | .020905 |
So the model explains a good degree more variance in strikeout rate than any singular variable, which of course what this is all about. Applying this to our 97 starting pitchers from the sample set, there are 50 starting pitchers that are within 1.5% (either above or below) of their actual 2011 K%, there are 35 above 1.5% (outperforming their expected strikeout rate), and there are 12 under 1.5% (under-performing their expected strikeout rate). The full results with analysis of a couple cases thereafter:
| Name | x2011K% | 2010 K% | 2011 K% | FBv | SwStr% | Difference |
|---|---|---|---|---|---|---|
| Zack Greinke | 0.214 | 0.197 | 0.281 | 92.5 | 0.106 | 6.7% |
| Cliff Lee | 0.200 | 0.220 | 0.259 | 91.5 | 0.093 | 5.9% |
| Tommy Hanson | 0.204 | 0.205 | 0.263 | 91.2 | 0.100 | 5.9% |
| C.J. Wilson | 0.178 | 0.200 | 0.225 | 91 | 0.083 | 4.7% |
| David Price | 0.196 | 0.218 | 0.238 | 94.8 | 0.084 | 4.2% |
| Madison Bumgarner | 0.187 | 0.182 | 0.226 | 91.7 | 0.092 | 3.9% |
| Doug Fister | 0.129 | 0.129 | 0.167 | 90 | 0.067 | 3.8% |
| Paul Maholm | 0.104 | 0.121 | 0.141 | 87.4 | 0.057 | 3.7% |
| Jake Arrieta | 0.142 | 0.116 | 0.178 | 92.4 | 0.074 | 3.6% |
| Ian Kennedy | 0.185 | 0.207 | 0.220 | 90.3 | 0.088 | 3.5% |
| Ubaldo Jimenez | 0.186 | 0.239 | 0.219 | 93.5 | 0.075 | 3.3% |
| Clayton Kershaw | 0.241 | 0.250 | 0.272 | 93.4 | 0.111 | 3.1% |
| Yovani Gallardo | 0.209 | 0.249 | 0.239 | 92.7 | 0.090 | 3.0% |
| Anibal Sanchez | 0.213 | 0.187 | 0.243 | 91.7 | 0.109 | 3.0% |
| Justin Verlander | 0.229 | 0.237 | 0.258 | 95 | 0.102 | 2.9% |
| Gio Gonzalez | 0.200 | 0.201 | 0.228 | 92.5 | 0.095 | 2.8% |
| Felix Hernandez | 0.202 | 0.232 | 0.230 | 93.3 | 0.088 | 2.8% |
| Jonathon Niese | 0.173 | 0.192 | 0.200 | 90.6 | 0.082 | 2.7% |
| Javier Vazquez | 0.176 | 0.174 | 0.203 | 90.4 | 0.089 | 2.7% |
| Jeff Niemann | 0.157 | 0.175 | 0.184 | 91.1 | 0.074 | 2.7% |
| Livan Hernandez | 0.106 | 0.127 | 0.132 | 83.9 | 0.064 | 2.6% |
| Wandy Rodriguez | 0.180 | 0.217 | 0.205 | 89.1 | 0.085 | 2.5% |
| Ted Lilly | 0.174 | 0.212 | 0.198 | 87.4 | 0.085 | 2.4% |
| Mike Leake | 0.147 | 0.148 | 0.171 | 89.1 | 0.077 | 2.4% |
| Bruce Chen | 0.126 | 0.158 | 0.148 | 85.8 | 0.067 | 2.2% |
| Nick Blackburn | 0.091 | 0.098 | 0.113 | 89.7 | 0.048 | 2.2% |
| Colby Lewis | 0.181 | 0.232 | 0.201 | 89 | 0.082 | 2.0% |
| Mark Buehrle | 0.107 | 0.110 | 0.127 | 85.6 | 0.065 | 2.0% |
| Brett Myers | 0.153 | 0.192 | 0.173 | 88.4 | 0.073 | 2.0% |
| Jon Lester | 0.208 | 0.261 | 0.228 | 92.8 | 0.087 | 2.0% |
| Jonathan Sanchez | 0.211 | 0.252 | 0.230 | 89.9 | 0.097 | 1.9% |
| Ryan Dempster | 0.199 | 0.227 | 0.217 | 90.3 | 0.093 | 1.8% |
| Trevor Cahill | 0.146 | 0.151 | 0.163 | 89.1 | 0.076 | 1.7% |
| James Shields | 0.215 | 0.209 | 0.231 | 91 | 0.107 | 1.6% |
| Bronson Arroyo | 0.110 | 0.138 | 0.126 | 87 | 0.058 | 1.6% |
| Matt Garza | 0.220 | 0.176 | 0.235 | 93.7 | 0.112 | 1.5% |
| Scott Baker | 0.208 | 0.204 | 0.223 | 91 | 0.103 | 1.5% |
| Randy Wolf | 0.133 | 0.152 | 0.148 | 88.4 | 0.068 | 1.5% |
| Tim Hudson | 0.165 | 0.151 | 0.179 | 90.5 | 0.086 | 1.4% |
| Gavin Floyd | 0.176 | 0.189 | 0.190 | 91.2 | 0.084 | 1.4% |
| Roy Halladay | 0.223 | 0.221 | 0.236 | 92 | 0.108 | 1.3% |
| Josh Beckett | 0.216 | 0.201 | 0.228 | 93.1 | 0.105 | 1.2% |
| Jered Weaver | 0.202 | 0.258 | 0.214 | 89.1 | 0.091 | 1.2% |
| Rick Porcello | 0.121 | 0.120 | 0.133 | 90.2 | 0.063 | 1.2% |
| Justin Masterson | 0.162 | 0.171 | 0.174 | 92.7 | 0.075 | 1.2% |
| Jeremy Guthrie | 0.133 | 0.137 | 0.145 | 92.5 | 0.063 | 1.2% |
| Jason Vargas | 0.141 | 0.143 | 0.153 | 87.4 | 0.078 | 1.2% |
| Chris Volstad | 0.152 | 0.135 | 0.163 | 91.3 | 0.079 | 1.1% |
| Chad Billingsley | 0.172 | 0.209 | 0.183 | 91.5 | 0.076 | 1.1% |
| Ervin Santana | 0.177 | 0.177 | 0.188 | 92.8 | 0.084 | 1.1% |
| Derek Lowe | 0.155 | 0.165 | 0.165 | 88 | 0.081 | 1.0% |
| Tim Lincecum | 0.235 | 0.258 | 0.244 | 92.3 | 0.107 | 0.9% |
| Aaron Harang | 0.165 | 0.166 | 0.173 | 89.8 | 0.084 | 0.8% |
| A.J. Burnett | 0.199 | 0.175 | 0.207 | 92.7 | 0.100 | 0.8% |
| Matt Cain | 0.189 | 0.198 | 0.197 | 91.2 | 0.091 | 0.8% |
| Jake Peavy | 0.186 | 0.207 | 0.193 | 90.6 | 0.088 | 0.7% |
| CC Sabathia | 0.228 | 0.203 | 0.234 | 93.8 | 0.112 | 0.6% |
| Brett Cecil | 0.159 | 0.161 | 0.164 | 88.5 | 0.084 | 0.5% |
| Mike Pelfrey | 0.119 | 0.131 | 0.123 | 92.1 | 0.055 | 0.4% |
| Carlos Zambrano | 0.155 | 0.209 | 0.159 | 90.2 | 0.067 | 0.4% |
| Joe Saunders | 0.121 | 0.130 | 0.124 | 89.6 | 0.062 | 0.3% |
| Brandon Morrow | 0.259 | 0.283 | 0.261 | 93.9 | 0.115 | 0.2% |
| Chris Carpenter | 0.190 | 0.185 | 0.192 | 92.5 | 0.092 | 0.2% |
| Wade Davis | 0.131 | 0.157 | 0.132 | 91.4 | 0.059 | 0.1% |
| Freddy Garcia | 0.152 | 0.133 | 0.153 | 87.2 | 0.088 | 0.1% |
| Travis Wood | 0.155 | 0.205 | 0.155 | 89.9 | 0.068 | 0.0% |
| Jeff Karstens | 0.138 | 0.138 | 0.138 | 88.8 | 0.074 | 0.0% |
| Jake Westbrook | 0.130 | 0.149 | 0.129 | 90 | 0.063 | -0.1% |
| Mat Latos | 0.233 | 0.253 | 0.232 | 92.8 | 0.106 | -0.1% |
| Dan Haren | 0.203 | 0.217 | 0.201 | 90 | 0.099 | -0.2% |
| Bud Norris | 0.224 | 0.231 | 0.221 | 92.6 | 0.105 | -0.3% |
| Shaun Marcum | 0.196 | 0.206 | 0.192 | 86.9 | 0.103 | -0.4% |
| John Danks | 0.189 | 0.185 | 0.185 | 91.6 | 0.093 | -0.4% |
| John Lannan | 0.135 | 0.110 | 0.131 | 89.8 | 0.076 | -0.4% |
| Ricky Romero | 0.199 | 0.197 | 0.194 | 92.1 | 0.096 | -0.5% |
| Jhoulys Chacin | 0.186 | 0.230 | 0.181 | 91 | 0.082 | -0.5% |
| Joel Pineiro | 0.104 | 0.145 | 0.099 | 87.6 | 0.051 | -0.5% |
| John Lackey | 0.151 | 0.168 | 0.145 | 91.6 | 0.070 | -0.6% |
| Max Scherzer | 0.215 | 0.230 | 0.209 | 93.1 | 0.098 | -0.6% |
| Jair Jurrjens | 0.150 | 0.172 | 0.144 | 89.1 | 0.074 | -0.6% |
| Johnny Cueto | 0.172 | 0.177 | 0.165 | 93.4 | 0.079 | -0.7% |
| Cole Hamels | 0.238 | 0.247 | 0.230 | 91.7 | 0.113 | -0.8% |
| Homer Bailey | 0.200 | 0.215 | 0.189 | 92.2 | 0.093 | -1.1% |
| Jeff Francis | 0.125 | 0.153 | 0.113 | 84.7 | 0.070 | -1.2% |
| Jaime Garcia | 0.202 | 0.190 | 0.189 | 89.8 | 0.105 | -1.3% |
| Hiroki Kuroda | 0.208 | 0.196 | 0.192 | 92 | 0.103 | -1.6% |
| Kevin Correia | 0.133 | 0.179 | 0.117 | 90.8 | 0.057 | -1.6% |
| Chris Narveson | 0.197 | 0.196 | 0.180 | 87.8 | 0.104 | -1.7% |
| Randy Wells | 0.158 | 0.171 | 0.141 | 88.1 | 0.082 | -1.7% |
| Luke Hochevar | 0.171 | 0.168 | 0.153 | 92.7 | 0.082 | -1.8% |
| Carl Pavano | 0.132 | 0.129 | 0.107 | 89 | 0.071 | -2.5% |
| Ricky Nolasco | 0.192 | 0.221 | 0.166 | 90.5 | 0.089 | -2.6% |
| Fausto Carmona | 0.158 | 0.141 | 0.131 | 92.5 | 0.079 | -2.7% |
| Roy Oswalt | 0.185 | 0.231 | 0.157 | 91.4 | 0.080 | -2.8% |
| Jason Hammel | 0.151 | 0.183 | 0.123 | 92.9 | 0.064 | -2.8% |
| Edwin Jackson | 0.203 | 0.201 | 0.173 | 94.5 | 0.093 | -3.0% |
| Francisco Liriano | 0.240 | 0.249 | 0.189 | 91.8 | 0.114 | -5.1% |
Zack Greinke topping this list as the resident over-performer is probably misleading for a couple of very obvious reasons. One, his 2010 K% of 19.7% was about seven percentage points behind 2009, and the fact that his league change to the National League should also help his strikeout figures. His career rate of 21.1% would have been a more reasonable number to use instead of 2010 K%, but hey, we can’t cherry pick. 28.1% might be a little lofty looking forward for Greinke, but I also think the model probably underrates him at 21.4%.
Cliff Lee is an interesting one. His 25.9% K rate in 2011 is far and away the highest of his career. His career K% is 19.3%, so using the 2010 K% figure of 22% isn’t necessarily under-representing his skill set. But Lee also moved leagues and the last time he was with the Phillies, he posted the second highest K rate of his career. I’d bet that he won’t repeat 25.9%, but he should best 20% in the National League.
Also interesting is the pretty dramatic drop in K% for Travis Wood between 2010 and 2011. Objectively, because he doesn’t have a terribly long track record, you might expect him to land somewhere comfortably in between his 20.5 K% from 2010 and his 15.5% rate from 2011, but in this sample, he was one of only two pitchers to perfectly match his expected K% — so according to the model, he fully earned his 15.5 K% over the course of 2011.
The model predicts that several pitchers ought to have performed significantly better than they did in 2011 as well. In particular, it sees pitchers such as Jaime Garcia, Hiroki Kuroda, and Luke Hochevar having the skills to post stronger strikeout rates than they did in either of the last two seasons. And while it suggests Francisco Liriano is capable of more relative to strikeout rates, I suspect the rest of the Twins faithful feels the same way — and you’ll want to weigh his fantasy value less on whether he underperformed in strikeouts than whether he is healthy and manages to find the strike zone again going forward.
There are many interesting nuggets in the overall sample, but I encourage you to take each as merely another information point as you make plans for 2012. For pitchers stacked towards the middle, there’s probably not much of a story, other than the fact that you can take their 2011 rate with a little more confidence. For those on the poles, consider the back story (Greinke, for instance) but you might also consider them to be good candidates to regress or improve going forward.
Michael was born in Massachusetts and grew up in the Seattle area but had nothing to do with the Heathcliff Slocumb trade although Boston fans are welcome to thank him. You can find him on twitter at @michaelcbarr.
wow. really interesting article. I’m definitely going to be on the look-out for those variables as I get closer to draft day.